Forecast map and XC route planner
Is today an XC day, and if so, which way? The map and the route planner try to answer both, honestly.
The forecast map
The map shows a forecast field as coloured cells: thermal strength (W*, in m/s), convergence, cloudbase or an overall day rating. Slide through the hours of today and tomorrow and watch the day build and fade. Wind arrows show the flow, and the sun-and-shade layer shows which slopes are lit at that hour.
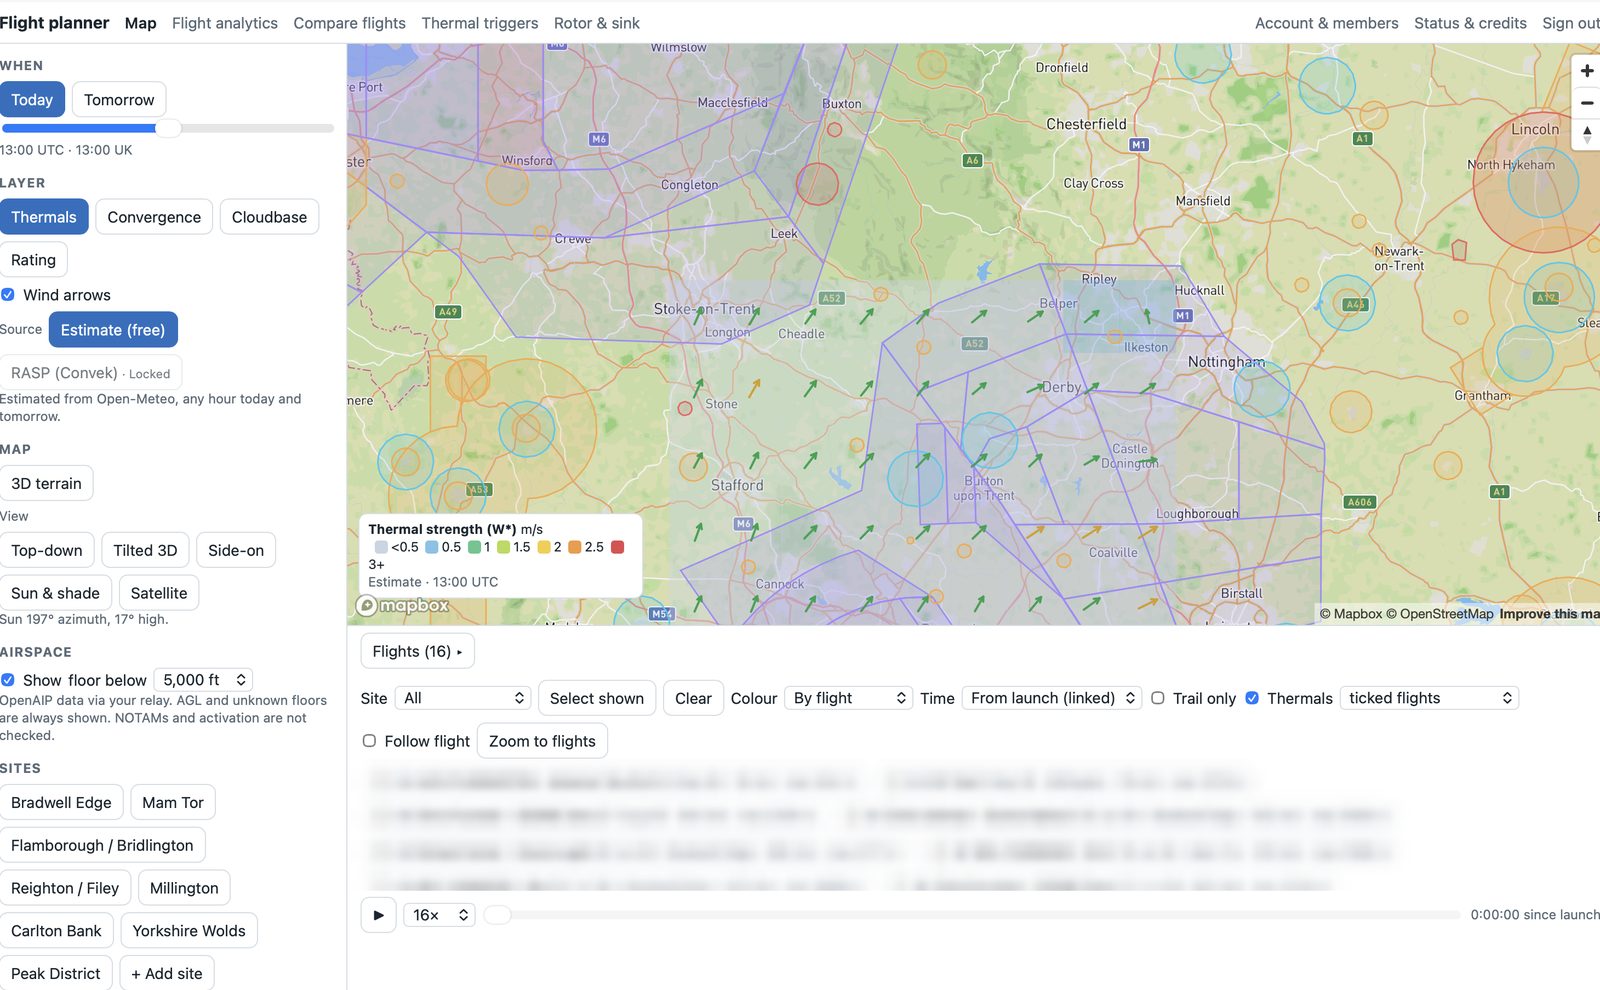
Airspace comes from OpenAIP and is filtered by floor height, so you only see what matters at the heights you'll fly. Floors given as height above ground, or unknown, are always shown, to be on the safe side. NOTAMs and activation aren't checked: that's still your job.
RASP and the free estimate
RASP (Regional Atmospheric Soaring Prediction) is the soaring forecast many UK pilots already check. It runs a detailed weather model on a fine grid (about 4 km) and turns it into numbers pilots care about: thermal strength (W*), the height of the boundary layer (how high thermals go), cumulus cloudbase, convergence and an overall star rating for the day.
The planner can show real RASP grids through Convek, a service that serves RASP data. When it's switched on, choose RASP (Convek) as the source on the map or for the route planner, and you get RASP thermal strength, cloudbase and convergence for today at 10:00, 13:00 and 16:00 UTC. The route planner uses the RASP level and keeps the free model's hour-by-hour shape and winds.
RASP grids cost money and come with a small daily allowance shared by everyone, so the button may say Locked (not set up) or Used up today. The planner then falls back to the free estimate, worked out from Open-Meteo's weather models. That covers any hour of today and tomorrow, but on a coarser grid of tens of kilometres, so treat it as the general picture and RASP as the detail.
The route planner
Choose a launch (a site or anywhere on the map), then either a goal or downwind with a maximum distance. Plan route forecasts thermals on a grid, scores likely trigger spots (ground facing the sun, convex ground), checks terrain and airspace floors along every glide, and picks climbs that make the most progress. Each leg shows speed to fly (MacCready, using the forecast wind at glide height), ground speed and arrival height, and the profile shows the climb-and-glide sawtooth.
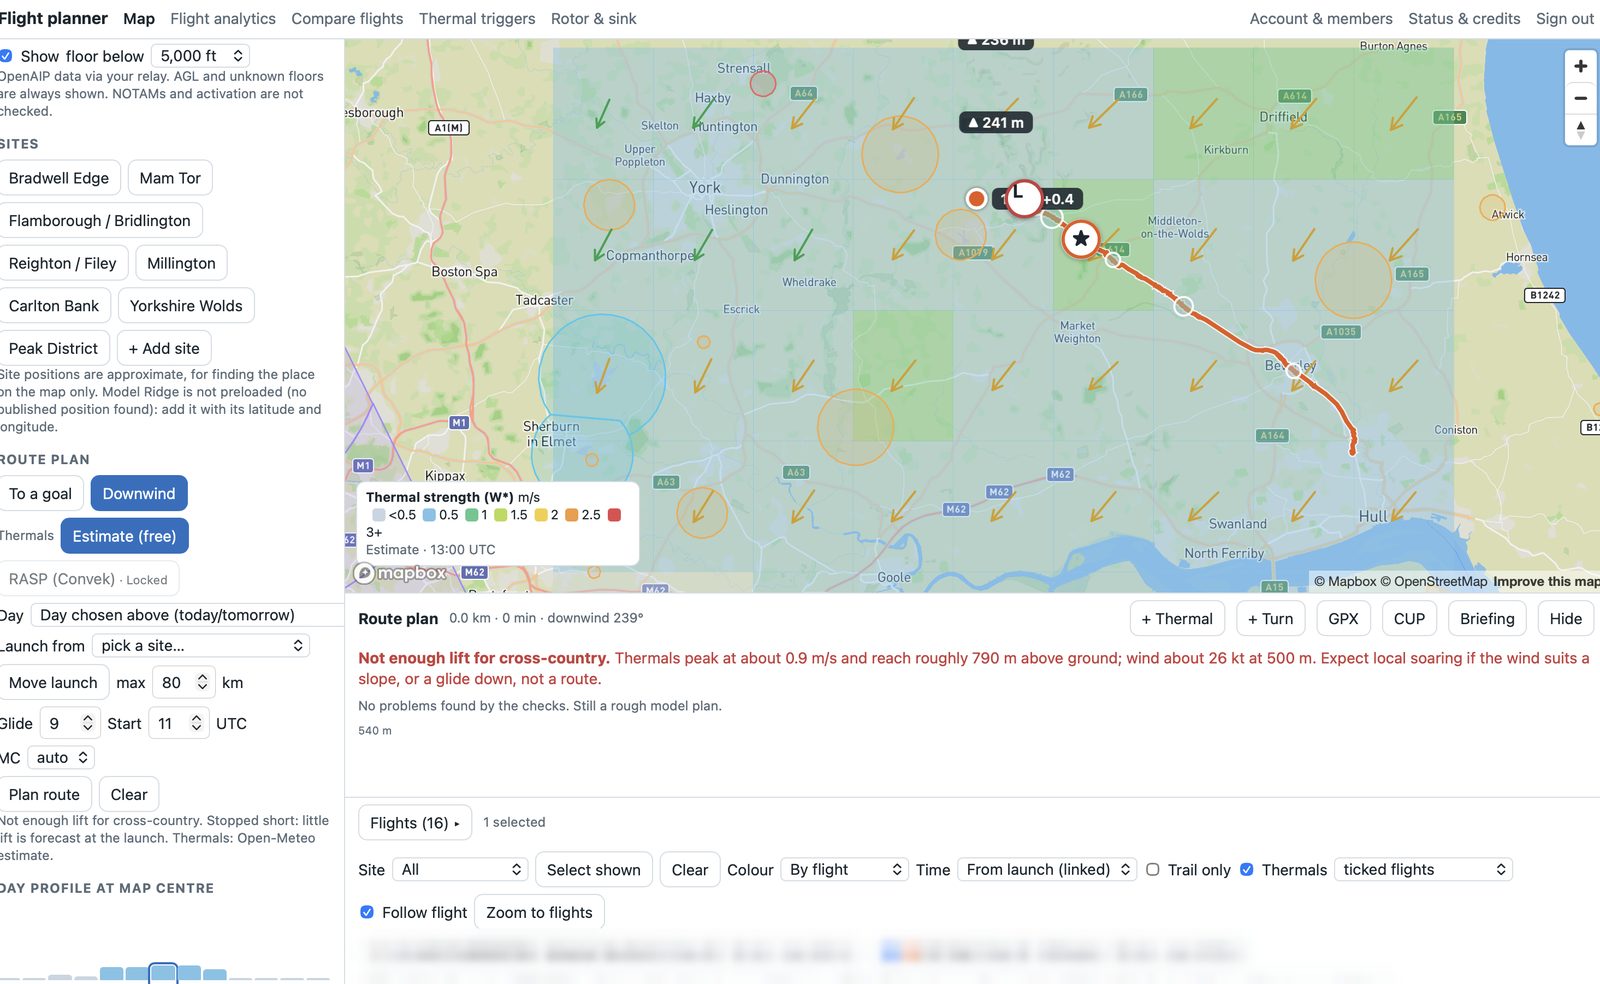
That red line matters more than the route. On a weak day the planner doesn't draw a heroic 80 km line: it says not enough lift and why. On a good day you get waypoints you can drag, extra thermals or turnpoints you can add, and exports to GPX (imports into the phone app), CUP and a text briefing.
Planning a day you've already flown
Pick one of your stored flights and the planner uses the archived model forecast for that date, sets the launch and goal from your flight, and draws what you actually flew as a black line next to the plan. It's a good way to see how far to trust the forecast at your sites.