What your IGC file says about your flying
Every flight log holds far more than distance and max height. The analytics page pulls out how you climbed, how you circled and when you left.
Drop in a file
On Flight analytics, drop one or more .igc files. They're read in your browser and, if you tick Save to the club planner, kept on the club server as yours, so they're on every device and count towards the club's thermal map. Flights can also come straight from the phone app.
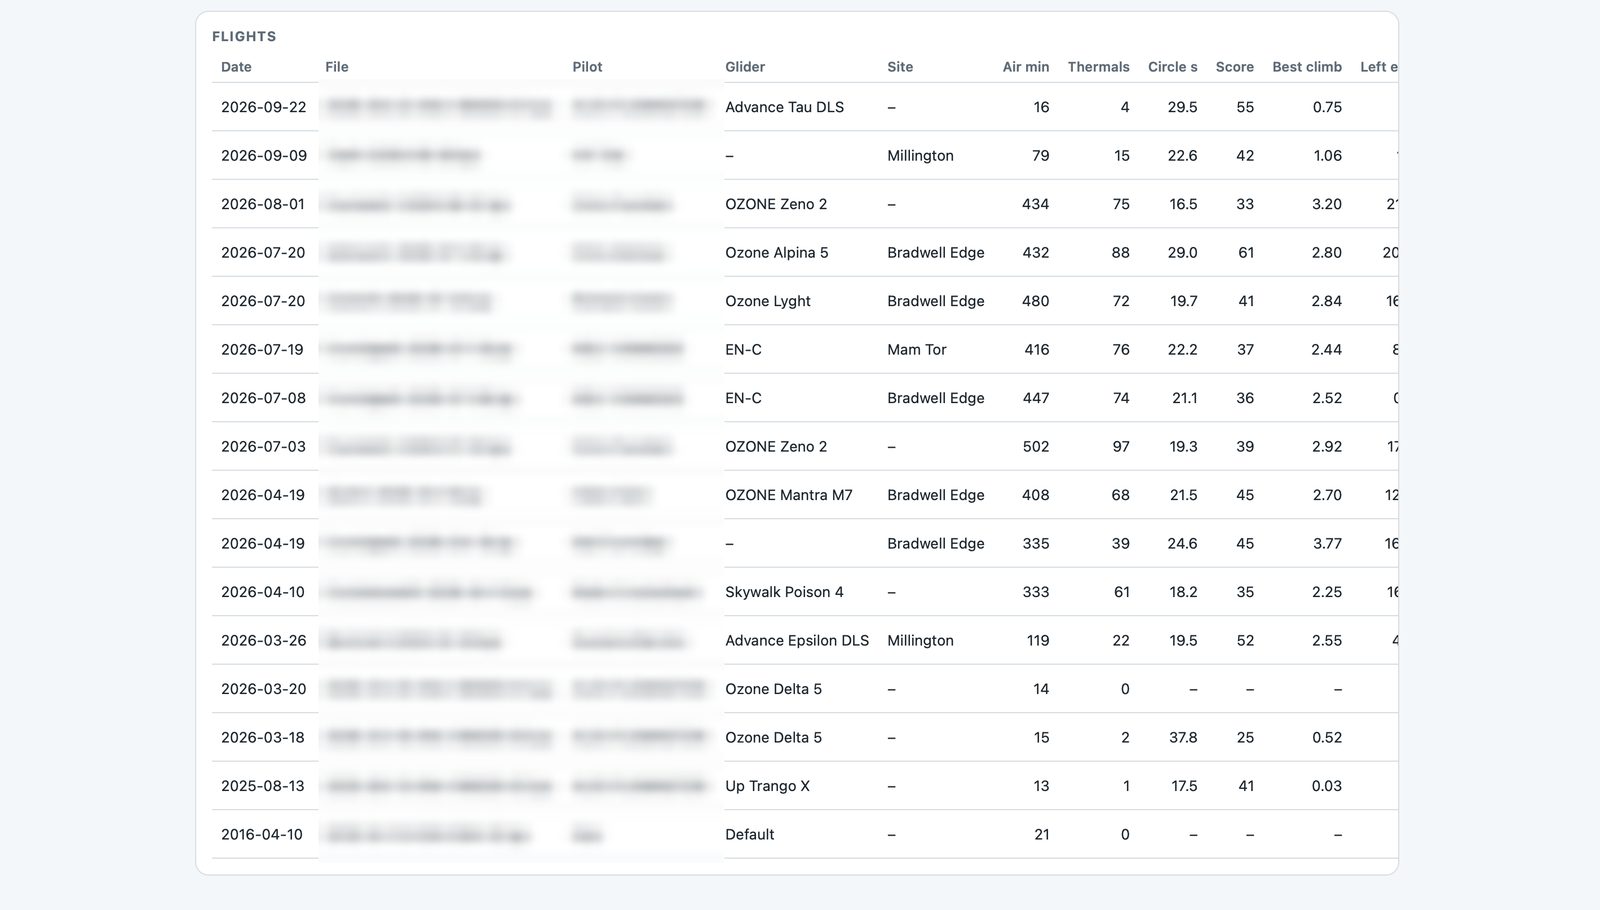
The numbers
- Circle time: how long one full turn takes. Tighter isn't always better, but very slow circles usually mean you're outside the core.
- Circle score (out of 100): how consistent your circles are (time and bank) and how steadily their centres move with the drift.
- Left early: thermals you left while still climbing at 1 m/s or more, below 80% of the forecast boundary layer.
- Topped out and reached BL: whether you used the height that was on offer, compared with the model's boundary-layer height.
- Climb vs best: your average climb as a share of your best thermal that day.
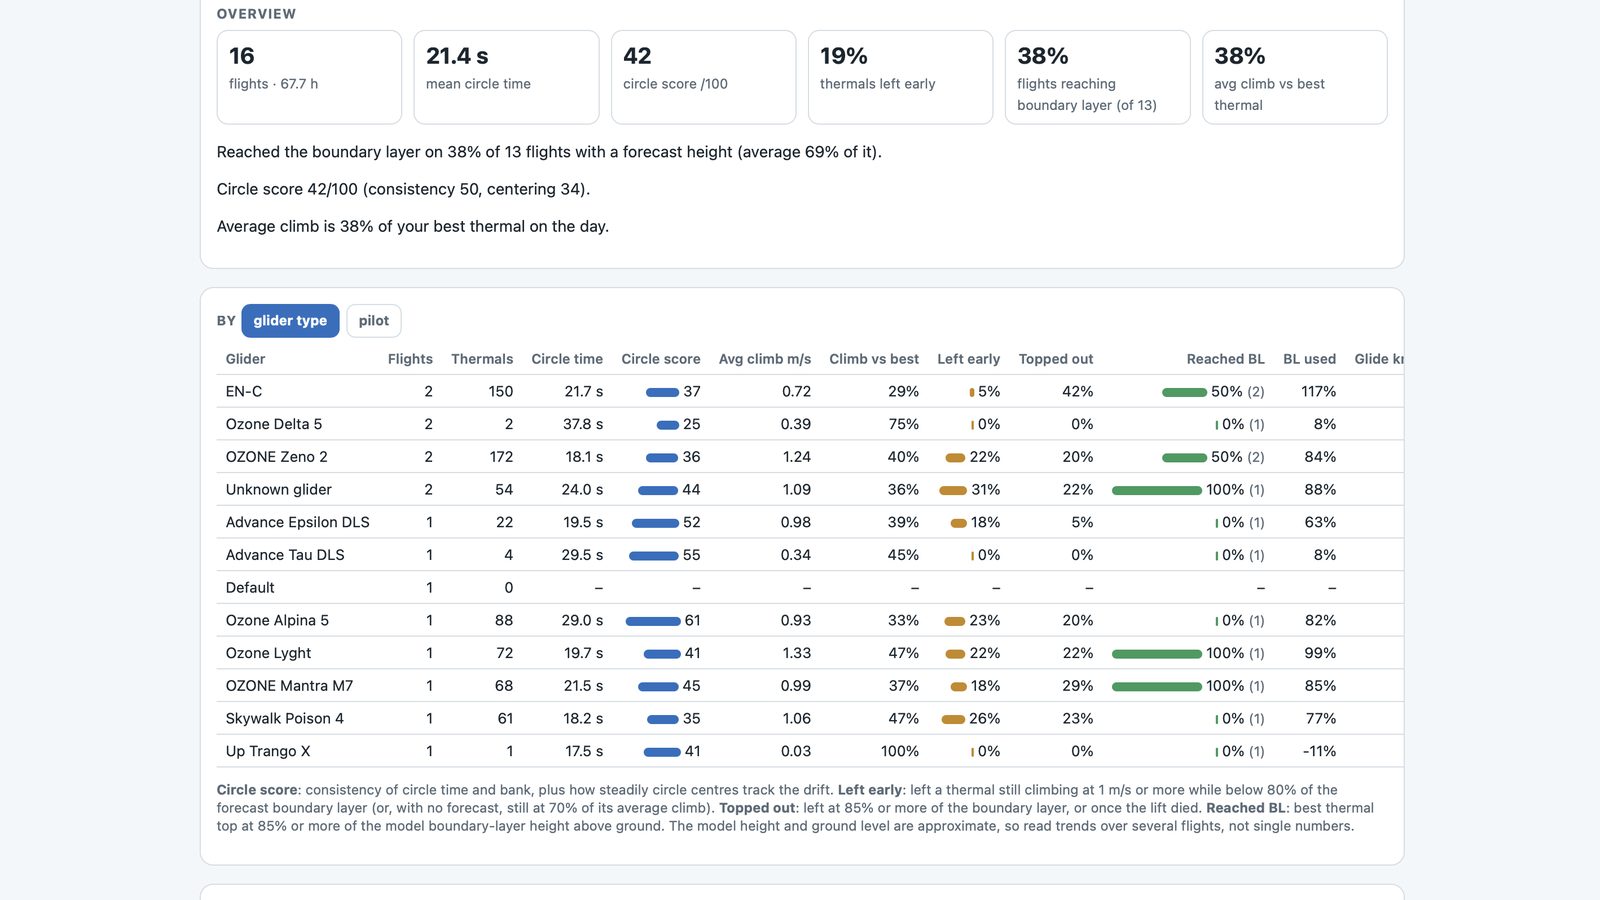
Group by wing or by pilot, filter by site, and click any flight for a thermal-by-thermal table. With a Vector vario the logs also carry airspeed, netto and measured wind, and the analysis uses them.
Compare flights
The Compare page puts up to four flights side by side, XContest-style: airtime, height gained, free distance, climb rates and glide, with the best value in each row marked. Pick yourself as the lead pilot and each row shows where you were ahead or behind, from height at 20 and 40 minutes to how often you glided at speed. Then come a few pointers for next time (get higher earlier, stay in climbs longer, tidy the circles, work lift you flew through), each with the numbers behind it. You can replay the flights together on the map, or in Google Earth with the launches lined up.