Advanced analytics: compare, learn, improve
The basic analytics tell you how a flight went. The advanced tools tell you why, by putting flights side by side and turning the numbers into things to try next time.
Compare flights
Tick up to four flights (filter by site first) and the Compare page lays them out side by side, XContest-style, with the best value in each row marked:
- The basics: airtime, maximum height and height gained, best climb and worst sink, tracklog length.
- Free distance with up to three turnpoints, and average speed.
- How the climbs went: number of thermals, circle score, how consistent and how well centred the circles were, thermals left early, and gain in the first thermal.
- Getting established: height above launch at 20 and 40 minutes.
- Gliding: average glide ratio (distance over height lost outside thermals) and how often you glided at speed (40+ and 50+ km/h).
The lead-pilot view
Choose a lead pilot, usually you. The table puts you first and shows how each other flight differs, in green or red. Comparing yourself with a stronger pilot on the same day is one of the quickest ways to see where the time goes: was it the first climb, the circling, or the glides?
Pointers for next time
Under the table, rule-based pointers pick out the biggest differences and say what to try, each with the numbers behind it:
- Get higher earlier: height at 20 and 40 minutes compared with the others.
- Climb faster, and tighten or steady your circles.
- Stay in good climbs instead of leaving them early.
- Work the lift you flew through.
- Glide more efficiently, and spend more of the glide at speed when the day allows.
Things you did well are listed too.
Seeing it on the map
A map shows each track with its free-distance route, thermal circles, and unworked lift: rings where you flew through lift of 1 m/s or more for 25 seconds or more without circling. An altitude profile lets you drag one marker along every flight at once, with thermal-strength bars beneath, so you can see who climbed where and when.
Thermal by thermal
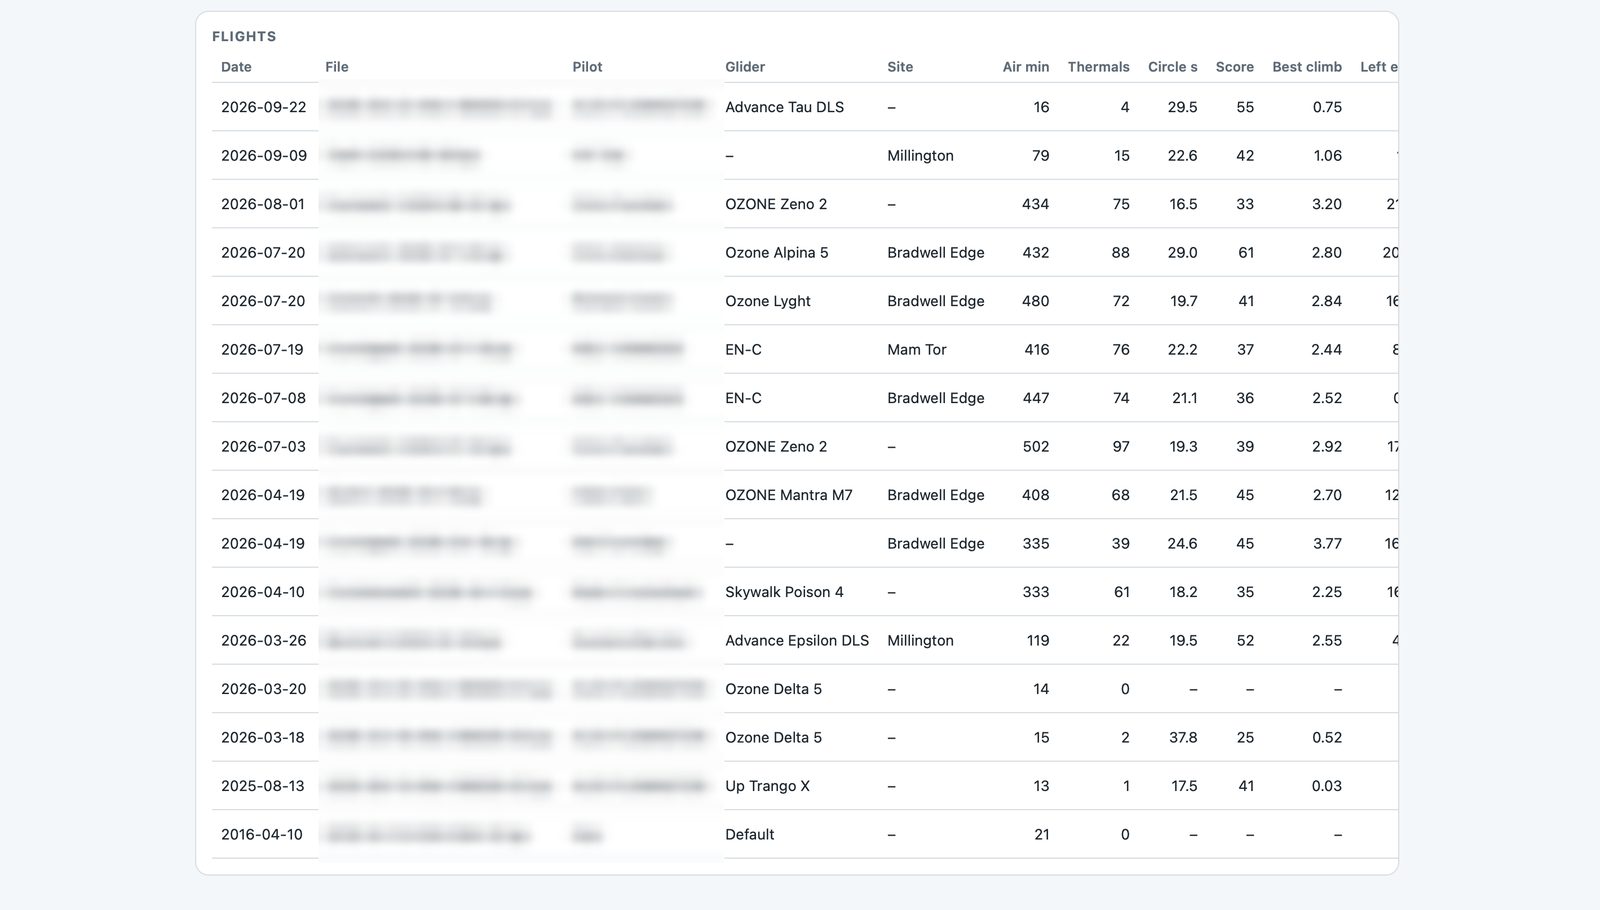
On Flight analytics, Thermals opens one flight climb by climb: how long you stayed, how many circles, circle time, height gained, average climb, how fast you were still climbing when you left, and how high you got against the boundary layer. Each climb is labelled: left early, topped out, or lift died.
With a Vector vario
If you fly with a Vector vario linked to the phone app, your logs also carry true airspeed, netto (how fast the air itself is rising or sinking) and measured wind. The analytics then show netto and wind for each climb, and Compare adds fast in lift, slow in sink: how much of your glide in rising air was flown at 40 km/h or more, and how much of your glide in sinking air under 36 km/h. That's the classic speed-to-fly habit, measured.
Google Earth replay
Open in Google Earth downloads the compared flights at their flown height with timestamps, optional thermal markers, and an option to line up launch times, so flights from different days fly together on Google Earth's time slider.