Where do Millington's thermals actually start?
Every pilot has a theory. The thermal-trigger map lets the flights decide.
Tracing a climb back to the ground
A thermal leans with the wind. By the time you're circling in it at 400 metres, it may have left the ground a kilometre upwind. For every climb, the planner measures the drift from the circles themselves (or uses the wind from a Vector vario), estimates how long the air took to rise, and traces the climb back to the patch of ground it probably came from. Then it looks at that ground: which way it faces, how steep it is, whether the sun was on it, and whether it's a hollow, a spur or open field.
Many flights pin it down
One climb only tells you the source is somewhere back along its drift line. But lines from different pilots, days and winds cross where the real trigger is. The overlap builds up into numbered spots, which you can rank by how many climbs point there or how strong they were.
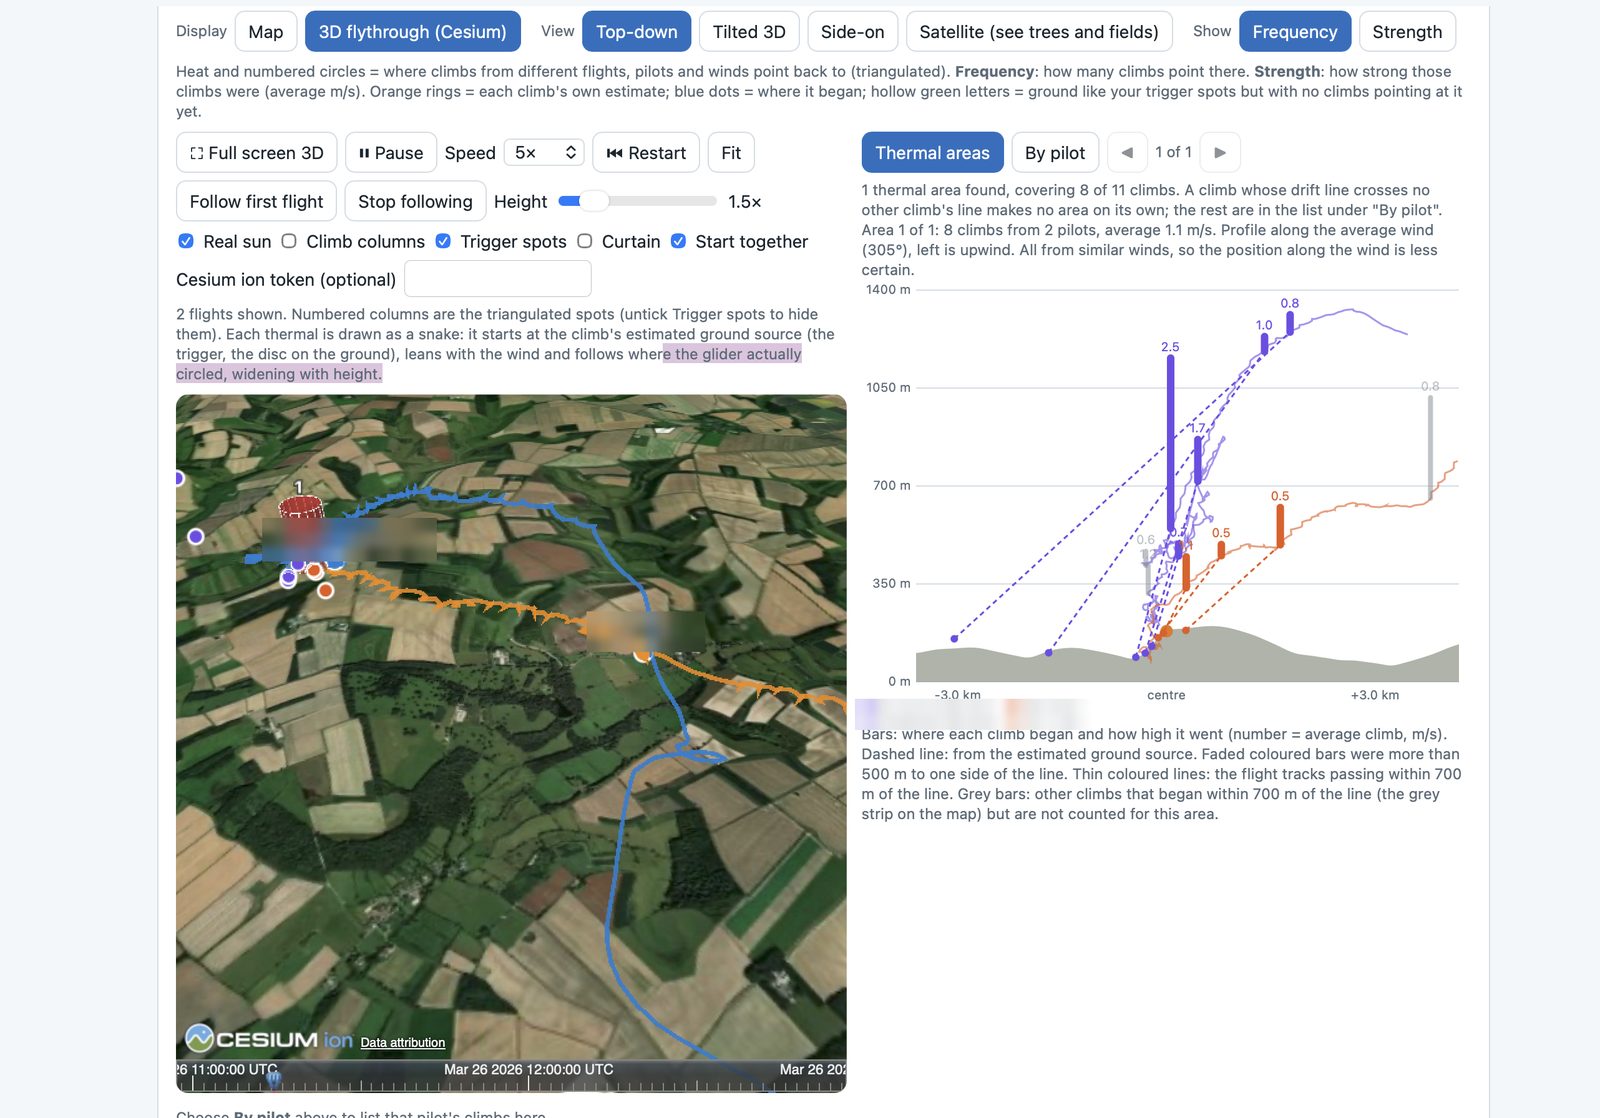
The 3D flythrough replays the flights over satellite imagery and the planner's terrain. Each climb is drawn as a "snake" that starts at its estimated trigger on the ground, leans with the wind and follows where the glider actually circled.
A first look at Millington
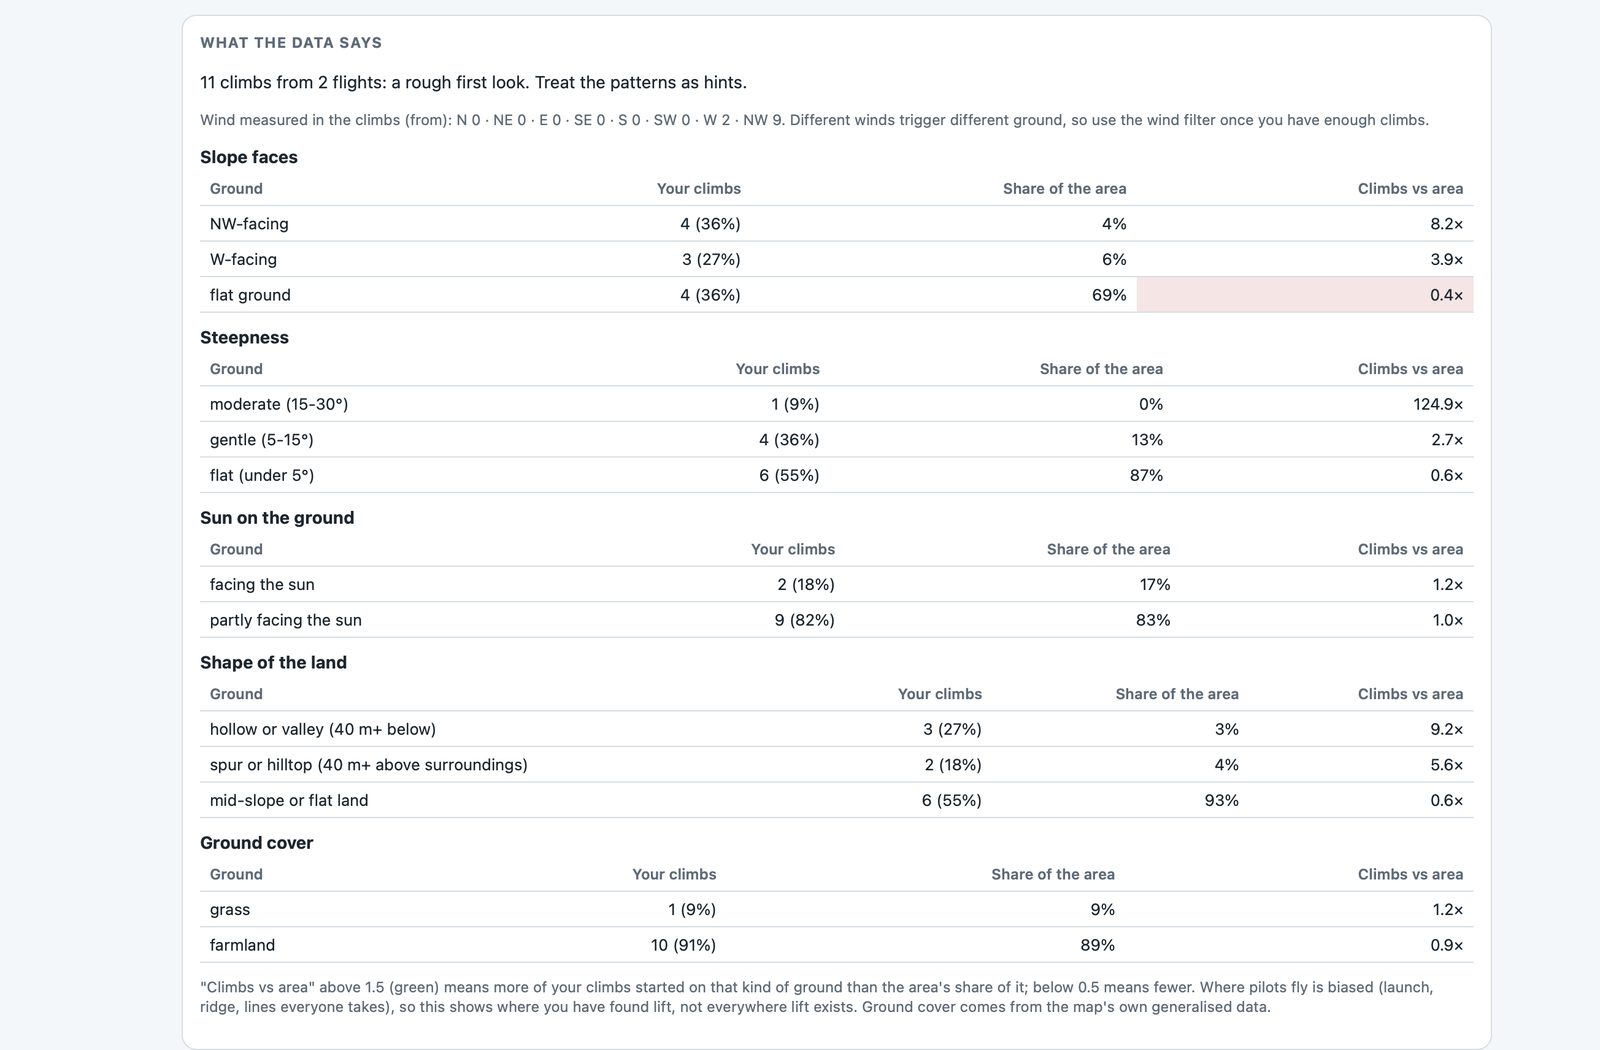
With only 11 climbs from 2 flights it's a rough first look, but a pattern is already hinting at itself. Compared with how common each kind of ground is in the area:
| Ground | Share of climbs | Share of area |
|---|---|---|
| NW-facing slopes | 36% | 4% |
| W-facing slopes | 27% | 6% |
| Hollows and valleys (40 m+ below surroundings) | 27% | 3% |
| Spurs and hilltops (40 m+ above) | 18% | 4% |
| Flat ground | 36% | 69% |

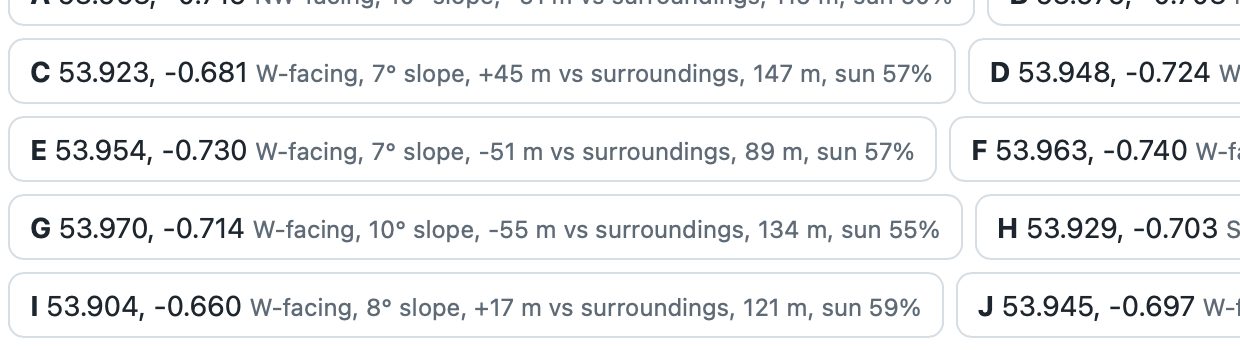
It also lists places worth checking: ground that looks like the trigger spots so far but has no climbs pointing at it yet.